Today Michael Oliver, the man who is well known for his deadly accurate forecasts on stocks, bonds, and major markets, shared with King World News exclusively that at this point in the gold market it is 2008, not 2013!
Gold: Yes, for the moment the bears are still in charge, but it’s 2008! not 2013!
July 15 (King World News) – Michael Oliver, Founder of MSA Research: When MSA puts the pieces together—technicals of gold and other major markets that affect gold—we arrive at the above headline. (See especially the MSA report of July 7th, “Gold: Context.”) This is more likely a drop that will be seen in hindsight as very similar to that brief event in October 2008. In our assessment this is not the beginning of the bear trend for gold – something, for example, like the genuine bear in gold that most investors only began to realize in earnest in April 2013 (MSA was major bearish in January 2012). For an in-depth comparison of those situations, see the July 7th report.
Our report yesterday suggested that this current drop in the stock market stands a good chance of not being of the arm-wrestling quality. Instead, perhaps something more rapid. The normal bear game in the S&P500 and NDX has been underway since our sell signals early this year, with layered declines and repeated “buy the opportunity” rallies. The numbers that will likely precipitate such a rapid drop this time were specified in yesterday’s report.
And so this month’s gold action, after having already dropped from a “buy the war” rally high in early March (always a bad idea for late longs), has put the asset down on the year. Into negative YTD performance like most portfolio assets, though of course a far lesser percent for gold. Still, the bears have been in control of gold since late March/April. And they now are trying to challenge the obvious price chart floor set by gold over the past two years. Namely, the March 2021 low of $1673, which was approached a second time last August. So far today’s low is $1695. Whether it comes out probably only means a drop of another few percent (if it comes out).
What about gold moving with any next stock decline, a decline which if occurs is likely to be more dramatic for the stock market than drops we have seen so far this year in the stock market. We have reasons to assume that while over recent several months gold has declined with stock market, we see that weekly momentum situation of gold is totally out of sync with stocks. S&P500 and NDX have just enjoyed a handful of upside weeks, especially evident on their weekly momentum, while gold has endured a handful of downside weekly momentum bars. Could well be the case that recent divergence persists, even with a renewed stock market drop.
Now to some larger context charts for your consideration.
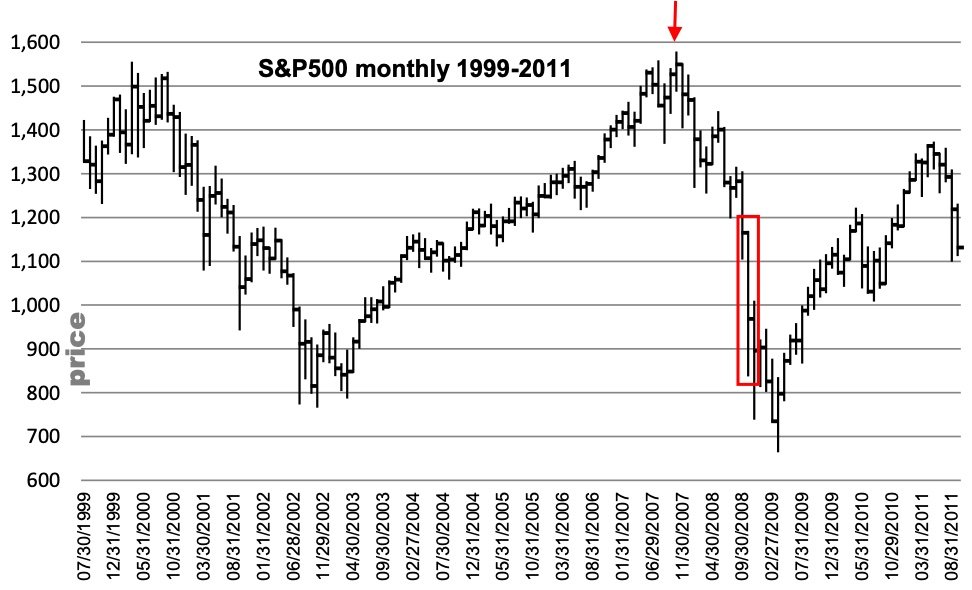
And so that last great bear market in stocks from 2007 to 2009 (which will ultimately be seen as trivial compared to this bubble collapse) crested in October 2007 and dropped in a layered manner. Then in October 2008 it finally produced what can be termed a crash event (meaning an over 30% drop in a matter of weeks). That crash is noted in red on the S&P 500 chart.
And that did not end the bear for the stock market. After a rally late in 2008 came a drop from a rally high in the mid -900s to a low in the mid-600s in March 2009.
Meanwhile, gold did briefly join in the selloff in stocks—for several weeks but only in October 2008 (the narrow red range on the gold chart).
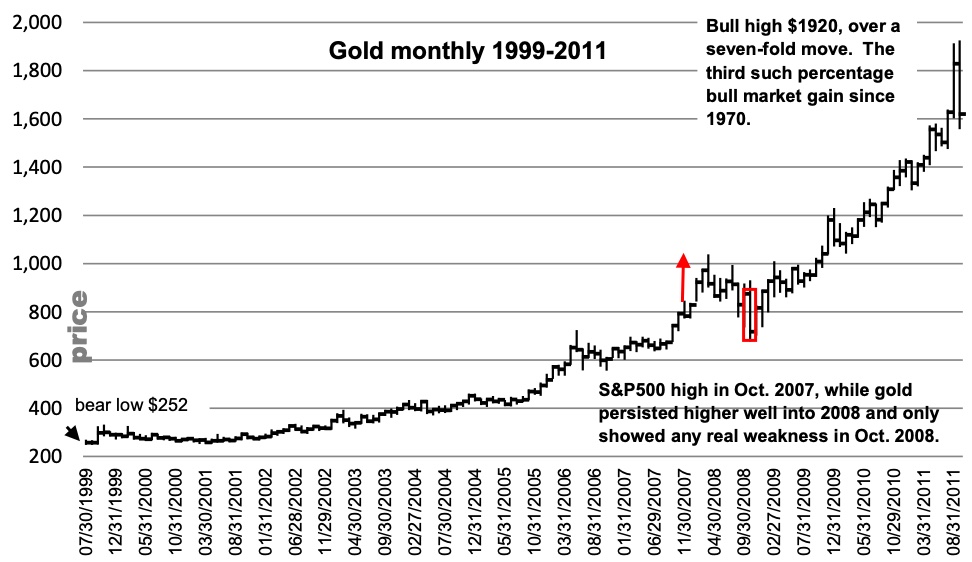
But then with the world and the markets clearly entering a global recession/depression (with the worst real-world repercussions yet to hit the man on the street), gold turned on a dime and was back at its highs by early 2009! And then it proceeded on its way to completing the bull trend that had begun from the bear low in late 1999. Overall, a dozen-year bull trend with that sharp interruption in 2008.
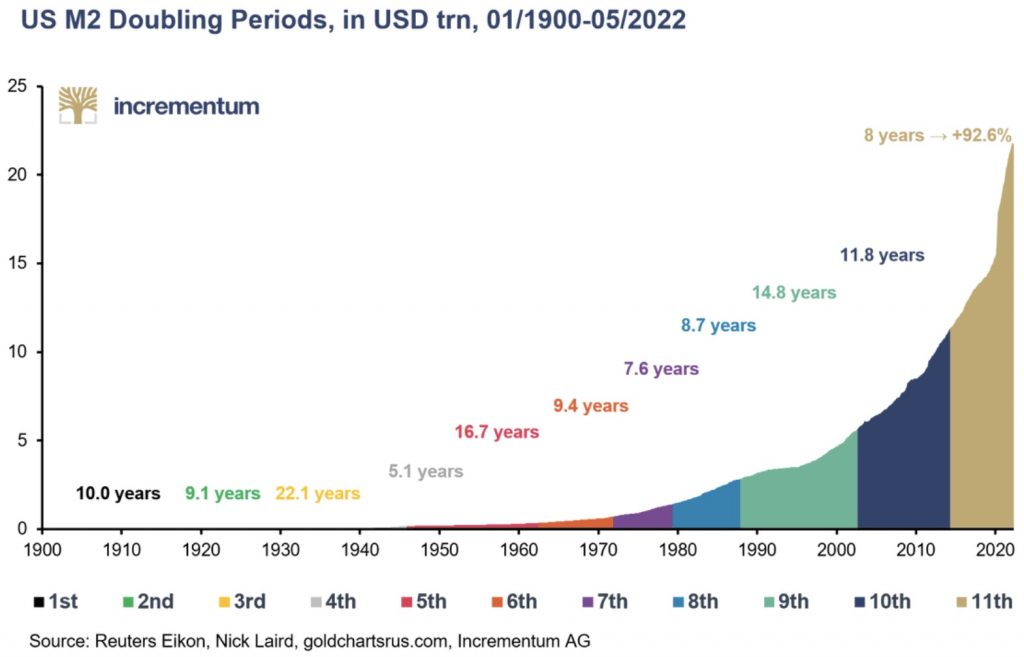
In hindsight, the October 2008 gold event was merely a pit stop en route to yet another massive percentage bull trend gain. Two prior seven-plus-fold gains were from the early 1970s to 1975 and from 1976 to 1980. Then came the 2011 bull trend, a third such geometric advance. Not rare, in other words. And you can thank two major benefactors: government monopoly money and central banks.
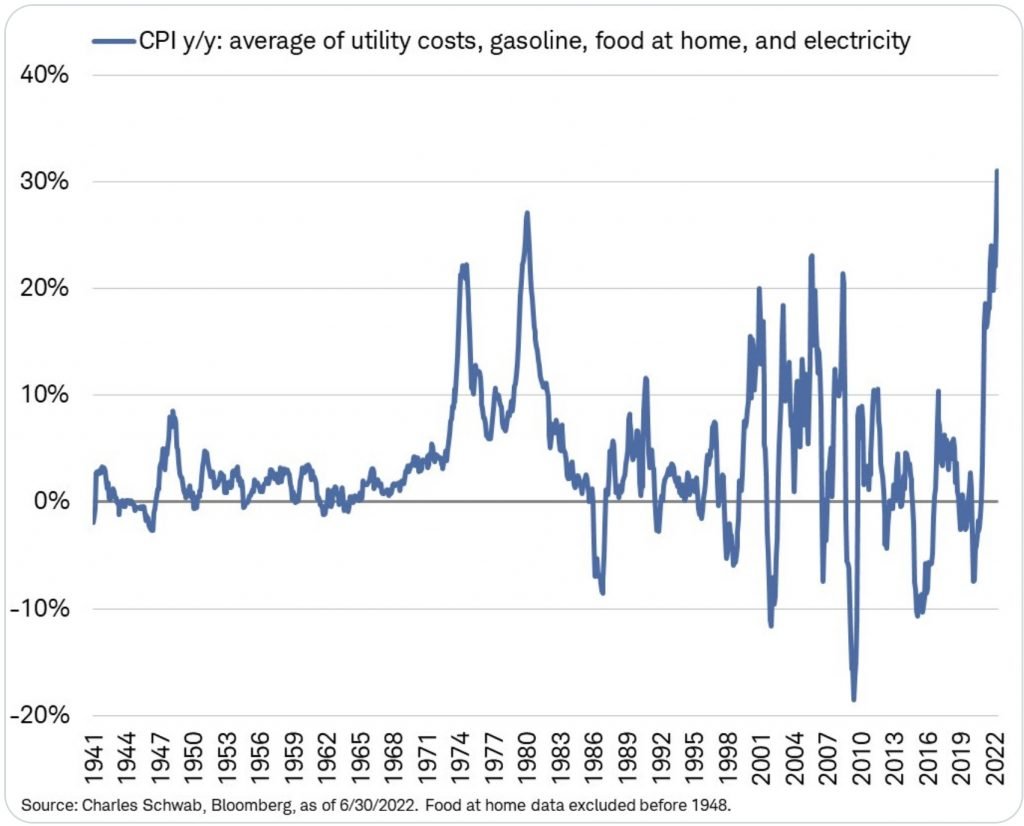
MSA wants to make another major point. There is a concept out there that seems to intellectually confuse most investors. We have long been taught by “those who know” that inflation means a commodity price rise. They do not wish us to focus on what the State and its central bank do to the expanding quantity of money (degradation) or the false pricing of money. Inflation is only “bad” when the price of corn or oil rises. Not when certain paper assets favored by government are falsely driven up in price—like government bonds, muni bonds, stock prices. That sort of dramatic and ongoing price rise is “good.” So we are told.
And so many well-schooled investors buy into that definition of inflation and therefore expect gold to reflect inflation as so defined—by commodity prices.
Take in the vista of commodity prices from 1999 to 2011, especially after the 2008 commodity peak. Then try to shape your gold investment/timing to the moves and trends in the commodity category. You would have missed the massive remaining portion of the ongoing gold bull trend in those years!

MSA is not arguing that the current commodity trend now is about to shift to a bear trend. In fact we hold that BCOM is likely to merely congest around its currently “moderately” high levels (the arrow and the black asterisk show where BCOM is trading right now in 2022, if you really think commodities are “high”) and then engage in another bull leg later. But do not confound and confuse what BCOM does and when it does it with the actions of gold. In the current gold bull trend (ongoing) gold doubled from late 2015 while the current BCOM laid in the mud from 2015-2020!
Gold holds it value over time due to the ongoing degradation in the value of the underlying money unit. What the central is really going to do over time (not their policy side steps from time to time) is what golds anticipates. Ongoing monetary expansion – to fund the state and to defend any other favored assets.
MSA argues that the most recent and largest paper asset bubble in U.S. history was created by the Fed and was ongoing for at least a dozen years. All of the financial press and Fed focus on recent, current and anticipated economic events and metrics. And that focus totally misses the major factor that is in play here. The erasure of a massive paper bubble tracing back a dozen years. Look back folks! Not forward! That’s where the ambush is coming from. Prior errors compounded.
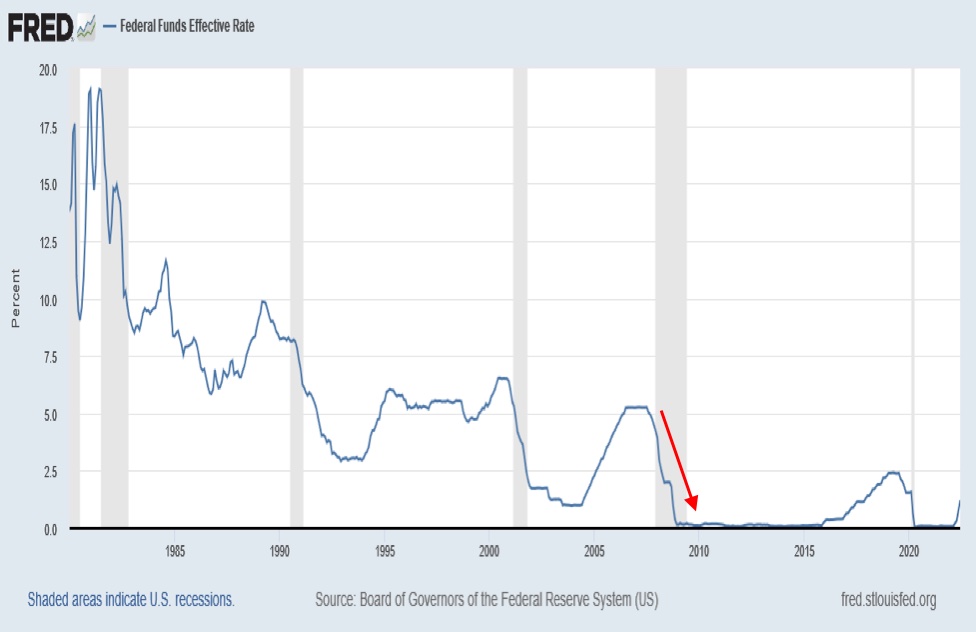
Gold “knew” when that relatively small paper asset bear market (compared to the one now) was underway in 2008 that there was no doubt that the Fed, after their brief “tightening” in 2007, would have to revert to that which they were designed to do. Support paper assets! And so, the collapse in Fed funds rate (merely one vista of Fed policy), QEs and the sharp ongoing rise in money supply came to the rescue in 2008-2009 and was ongoing for the next dozen years!

Any upticks in Fed Funds or pausing or slowing in that process over the years has generated market wobbles, hence soon gave the Fed rationale to go back to that which they do! Note the rise in rates in 2007. Stocks took in in the gut and sure enough the Fed dropped cost of money to effectively zero along with other Fed ploys. Did gold wait for that policy shift and sustained free money, QEs etc. before continuing its major bull trend back then? No. It halted its decline in October 2008 and quickly regained upside. Despite stocks and the economy weakening even more and despite commodities still very much depressed and broken. Gold knew what was to come. And it moved before the obvious.
What do you think the Fed will do when S– hits the fan with another leg of stock drop, and when it becomes more evident that unemployment data points are ancient metrics soon to be blown aside along with other “approved” metrics put forth by the government. Should an investor assume the Fed and other central banks will simply “Let it burn!” ? If you assume that, then be short gold. If you assume that central banks will go full throttle panic in their normal direction (and in turn lose public and academic credibility big time) then rethink your negative views on gold—now…to subscribe to Michael Oliver’s MSA Annual Research at a special KWN discounted rate CLICK HERE. Look at these testimonials:
“MSA looks at the market from a somewhat different point of view. Rather than focusing on price, something that virtually everybody does, MSA tracks momentum, [revealing] trends that have been building for a long time, and have much more depth to them and staying power.” — Wall Street Journal
“A friend shared about 5 of your recent letters with me, and I was so impressed I had to subscribe.” — Bill Fleckenstein, Hedge Fund Manager
© 2022 by King World News®. All Rights Reserved. This material may not be published, broadcast, rewritten, or redistributed. However, linking directly to the articles is permitted and encouraged.